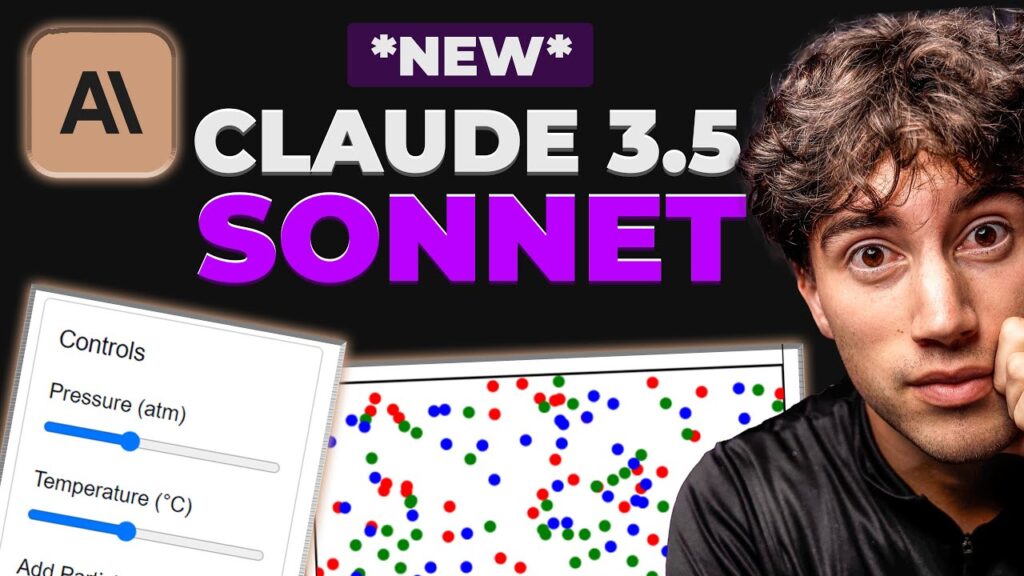
The Claude 3.5 Sonnet AI model has taken the world by storm with its plethora of amazing features. From transforming static research papers into interactive dashboards to creating visually stunning mind maps and presentations, this tool offers limitless possibilities for users.
One of the standout features is the ability to generate animations and designs, which can breathe life into any concept or idea. Whether it’s animating the water cycle or creating organizational charts, Claude 3.5 Sonnet excels in making complex information easily digestible.
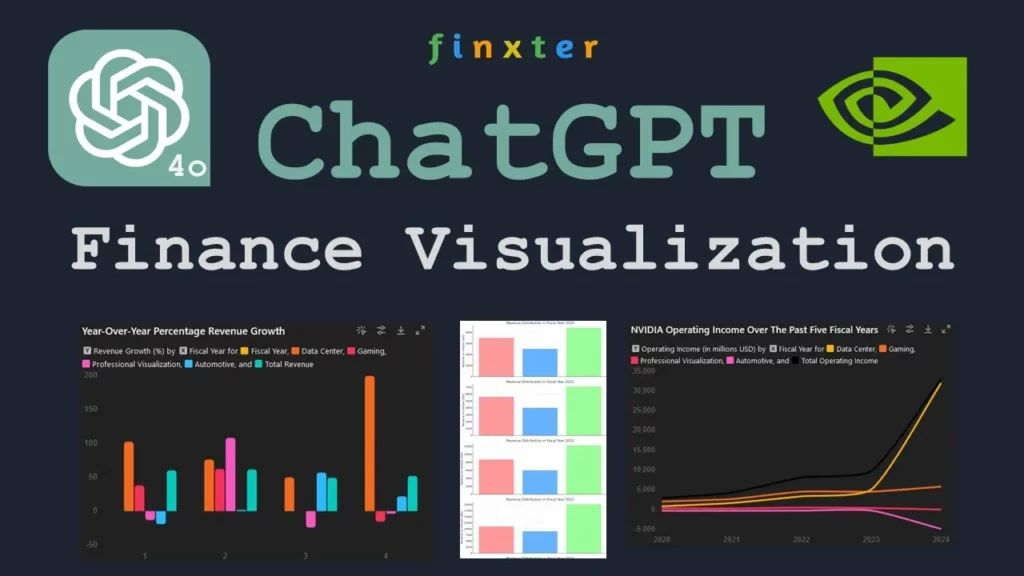
Data visualization is another forte of Claude 3.5 Sonnet, allowing users to transform raw data into interactive charts and graphs with just a few prompts. The AI can create various types of charts, like line graphs or bar charts, based on the user’s preferences, making data interpretation a breeze.
Moreover, Claude 3.5 Sonnet is no slouch in the analysis department either. While it may not match the strength of other models in detailed analysis, it still provides valuable insights when asked to analyze data tables. The tool can also assist in creating interactive flowcharts to visualize research processes effectively.
For brainstorming and conceptualizing ideas, this AI model shines by combining different theories into interactive diagrams. Users can merge complex concepts like Innovation System Theory and complexity Theory into visual representations, aiding in the development of research frameworks.
In conclusion, Claude 3.5 Sonnet is a powerhouse of creativity and functionality, offering users a wide array of tools to enhance their projects and presentations. Its ease of use and versatility make it a must-have for anyone looking to elevate their data visualization, analysis, and design capabilities. Experience the magic of Claude 3.5 Sonnet and unlock a world of innovation at your fingertips.


